
Meetings with your service providers will often present you with a lot of data that may not be easy to understand. Your child’s school and therapy services will more than likely collect and assess progress information.
Data is a crucial part of our programming. When we review it, we want all of our parents to feel comfortable with what it is and what it means. Obtaining data is one of the most important aspects of ABA.
Data can show us if your child:
1. Is improving or regressing with a skill.
2. Needs a new intervention.
3. Is ready to move on to more advanced skills.
4. Needs to focus on different skills to become more successful.
BCBAs use data to make decisions for the direction of programs in order to make your child most successful. Without it, we cannot progress onto more difficult tasks and skills to develop.
When we look at the data, your BCBA will be able to explain what the graph means in regards to the progress of your child. Sometimes we want the graph to slope upwards, and sometimes we want it to slope down. This depends on whether the goal is for the behavior to increase or decrease. Either way, a flat line means something needs to change.
How do we collect data?
ABA utilizes a variety of methods to obtain useful and relevant data, but here are a few to start.
1. Baseline Data: This data collection method is the first to be implemented. Before any treatment or therapy can actually take place, we must have a better understanding of where the child’s skill levels are.
Baseline recording takes place without any intervention from the therapist. We simply observe and record the behavior in order to have a starting point for comparison. This allows us to see the effectiveness or ineffectiveness of implemented strategies.
2. Frequency Recording: This method records the number of times a child exhibits a behavior or response. The therapist will tally up every occurrence throughout the session.
3. Rate Recording: This type of data is the same as frequency recording, except the number of occurrences is measured over time.
For example, if a child spills their milk 4 times over a 2 hour session, the data recorded will show that the child is spilling 2 times per hour. This method is used for consistency over sessions that are different lengths of time.
4. Task Analysis: If a behavior you are trying to influence is complicated or has multiple steps how do you measure it? With a task analysis!
This method breaks down the behavior into individual steps in order to better understand where progress is being made, and where struggles are taking place.
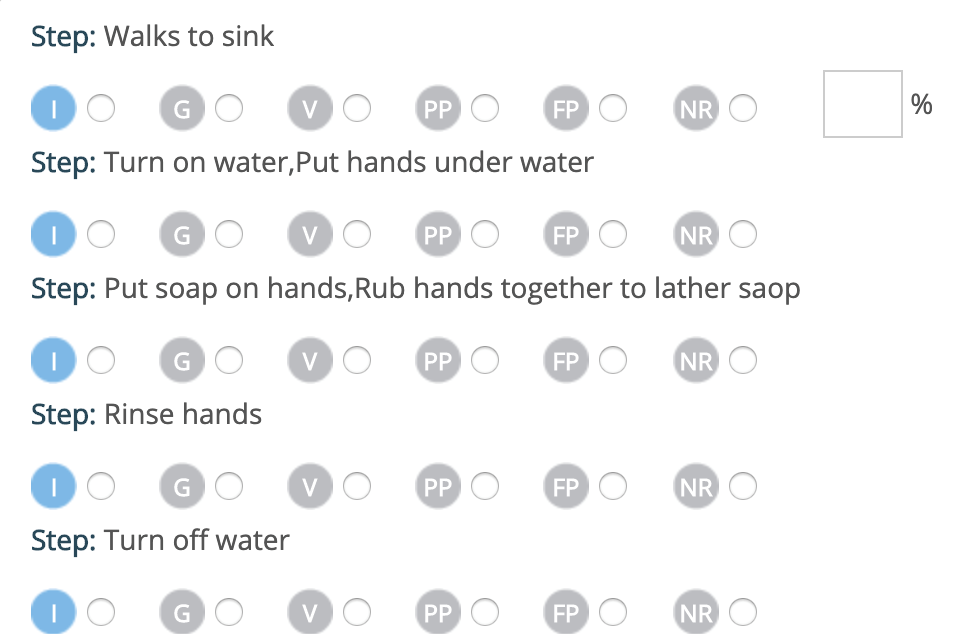
Here we can see a task analysis for the target behavior “Washing Hands.” It is broken down into 5 steps, and your RBT will record whether the step was completed independently, or if a certain prompt was needed.
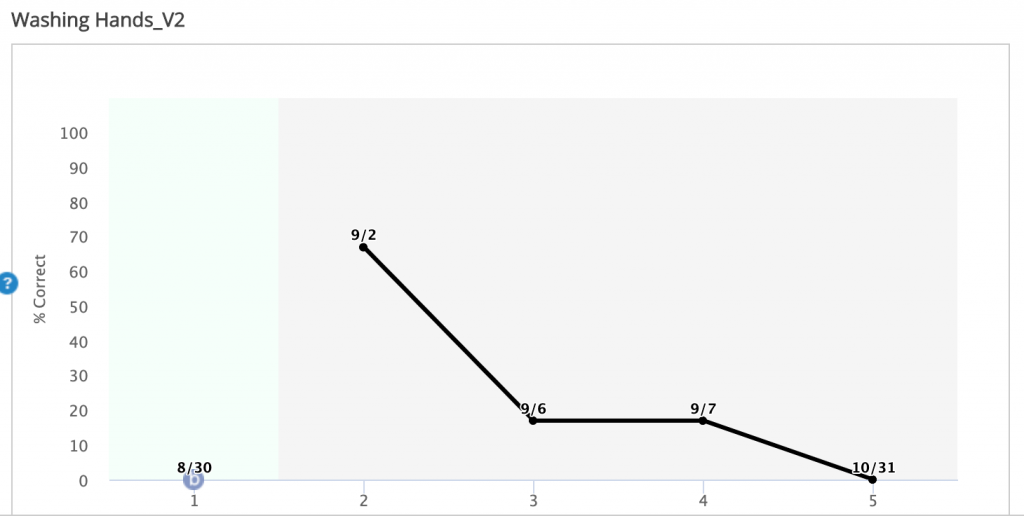
This is what a graph for a task analysis might look like. As we can see, the % correct is steadily dropping over time. A BCBA that recognizes this trend will know new implementations are needed in order to help the child better learn the skill.
5. Duration Recording: This method measures how long a behavior occurs. For some behaviors, it is more beneficial to measure its length rather than its frequency.
For example, if we want to document a child doing homework, frequency may not be the best method. Measuring the duration of homework time can help us show how it has increased or decreased over time. This will let us know whether our intervention strategies are effective.
In Conclusion:
Data can be confusing, but is extremely informative! Keep yourself in the know about your child’s progress and their behaviors. Ask your provider questions about what certain data points mean and what their goals are!